
Assignment: 04-Stem and Leaf Plots
Stem-and-leaf plots are just another way of representing data. Stem-and-Leaf plots work best if all of the numbers in the data set are greater than 9 and less than 100 (between 10 and 99).
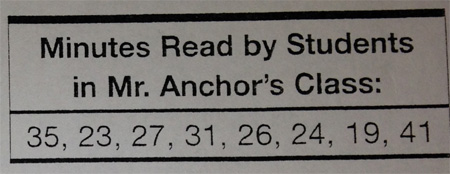
Let’s say there are a group of 8 friends who want to chart their reading minutes for a week. Below is a chart showing the amount of minutes they have read.
 The first stem in creating a stem-and-leaf plot is to put the numbers in order..
19, 23, 24, 26, 27, 31, 35, 41
From there, think of the stem as the tens, and the leaf as the ones. We are going to create a table with two columns, putting the tens into one column, and the ones in the other, the ones being adjacent to the 10 they were with.
