Assignment: 05-Bar Graphs
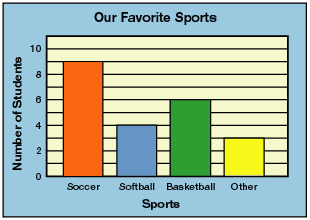
 Above is a visual representation of a bar graph. It is one of the simpler types of graphs we’ll work with this year. Coincidentally, it’s also one of the more common types of graphs we’ll continue to see throughout life. To a point, it is similar to what we’ve worked with using the regular coordinate plane. Notice the y-axis works exactly the same, where the numbers get larger the higher up they get. There will always be a label next to the y-axis telling what those numbers represent. In this case, the y-axis represents number of students. The title, “Our Favorite Sports” tells us that it represents the number of students who like a certain sport. The specific sports in question move along the bottom of the graph.
We could read this graph to know that 9 students chose soccer, 4 chose softball, 6 chose basketball, and 3 chose something different.
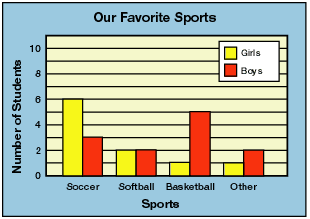
 This second graph is a double bar graph. A double bar graph works the same way, but takes it one step further. Notice the key in the top right corner. It tells us that the yellow bar stands for the girls and the red bar stands for the boy. From this graph we can now tell that of the 9 students who chose soccer, 6 of them were girls and 3 of them were boys. You would be able to see this same information for softball, basketball and other as well.
