
Assignment: 09-Mean Absolute Deviation
Temporarily taking math out of the picture, the word deviation simply means a change from the normal. In mathematical terms, deviation is how far a number is away from the norm, in this case, the mean, or average. The first step in this process is to find the mean of a set of data. Let’s use the set of data below.
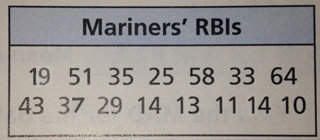
It’s a list of Runs-Batted-In for 15 players on the Seattle Mariners. To find the average of these numbers, we have to start by adding them all together.
15+51+35+25+58+33+64+43+37+29+14+13+11+14+10 = 456
To find the average we then have to take that total and divide it by the amount of numbers, 15.
456 ÷ 15 = 30.4
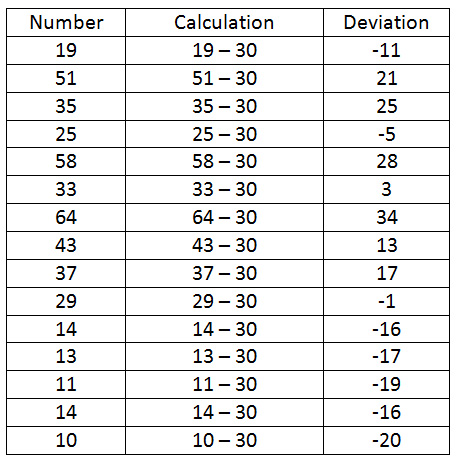
Now that we have our average, we are able to calculate the deviation for each of the numbers. Deviation is dimply the difference between the number and the average. If a number is higher than the average, than its deviation will be positive. If a number is below the average, then its deviation will be negative. The one problem we will come across is that we have not learned how to add and subtract with negative decimals. For this reason, we are going to round our mean to the nearest whole number.
30.2 would round to 30
Below is a chart showing the deviation for each of the numbers in the data set.
The final calculation which will be expected is known as the Mean Absolute Deviation, or MAD for short. This is also known as the Standard Deviation. Simply put, this is the average of all of the deviations we just calculated. This will require that we add positive and negative integers. For a review on this topic, click here.
To find the MAD, we have to start by adding all of the deviations together.
-11 + 21 + 25 + -5 + 28 + 3 + 34 + 13 +
17 + -1 + -16 + -17 + -19 + -16 + -20 = 36
The next step in finding the MAD is to divide by the total amount of numbers, 15.
36 ÷ 15 = 2.4
This single number can tell us a lot about the data. The fact that it is positive tells us that there are more numbers above the mean than below. The closer it is to zero, the more evenly spread out the data is.