Topics
1. Patterns and Equations
2. Patterns, T-Tables, and Graphing
3. T-Tables and Equations from Graph
4. Problem Solving
Patters and Equations is basically a review of topic 1 from week 19.
Patterns, T-Tables and Graphing is a review of topic 2 from the same week
Problem Solving will be working more with the RICE problem solving method, and the Bar Model that we discussed in Topic 3 of Week 4
T-Tables and Equations from Graphs
There are a few ways to determine the equation of a line when given the graph. With the knowledge we currently have, the easiest way would be to determine a few known points on the line, make a t-chart of those points, and then determine the equation from the t-chart.
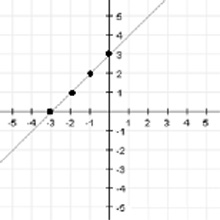
The graph above has 4 points labeled: (-3,0), (-2,1), (-1,2), and (0,3). Step 1 is to take a few known points and make a t-chart out of it.
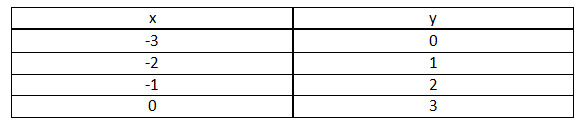
Once we’ve made the t-chart, it’s time to analyze the points and figure out the pattern. An equation has to be set up as y=something, so ask yourself, what do you have to do to the x-coordinates to make it the y-coordinate? Can you add? Subtract? Multiply? Divide? Look at the first coordinate. What can you do to -3 to make it 0? You could multiply by 0. Does that work for the other coordinates though? No. You can add 3. -3+3=0. Does that work for the others? Yes. -2+3=1, -1+3=2, and 0+3=3. Take that rule of add 3 and turn it into the equation. The equation for this graph would be:
y=x+3