
Topics:
1. Two Step Equations
2. Graphing Inequalities
3. Solving Inequalities
Two Step Equations:
Solving two step equations is the exact same concept as one step equations. For a review on one step equations, click here.
Here is an example of a two step equation:
2x + 10 = 34
As I said, the goal is the same, to get the variable alone. The way to do that is the exact same, by using the opposite operation. You always want to start with the addition or subtraction, the numbers that are not directly connected with the variable. In this case the ‘+10′ is what we will get rid of first. To get rid of add 10, we subtract 10:

At that point, you have a one step equation. The opposite of multiply 2 is to divide 2.

Rather than taking the whole thing on at once, another way to think about it is through two one step equations. Let’s take the equation 4x – 6 = 22. We are going to disguise the first variable and coefficient. For fun, we’ll use a flower and say that the flower is equal to 4x.
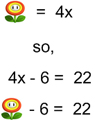
We now have a one step equation to solve. Using the opposite operation, we get rid of the ‘-6′ by adding 6.
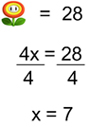
 From there we substitute the 4x back in for the flower, and once again, using the opposite operation, we can divide by 4 to get the solution.
Graphing Inequalities
We have previously been made familiar with inequalities in such ways as:
7 < 12
or
1/2 > 1/4
There are two new symbols we need to become familiar with. We know the first two, pay careful attention to the next two:
- > Greater than
- < Less than
- > Greater than or equal to
- < Less than or equal to
These second two symbols are used more when we are working with a set of data, rather than a single number. It could look something like this.
{8, 9, 10, 11, 12} > 8
However, the set of data won’t commonly be represented as a set of data, but rather a varaible:
a > 8
Having an inequality like that will commonly lead us to a line graph. You will have to mark the number to begin at, which in this case is the 8, and then draw an arrow to represent the variable, or set of data. There are two different marks used to mark the starting position. We call them an open circle or a closed circle. To know which circle to use, you simply have to look at the sign being used.

A little hint to remember it, when we plot a point on a number line we use a filled in dot. If our inequality can be equal to the value, the dot is filled in as well. the open circle represents the gap, meaning it cannot be equal to it.
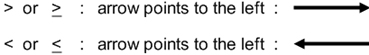
The other thing you need to know when graphing an inequality is which way to draw your arrow. This is fairly easy to remember because the direction of your inequality sign is the same as the direction of the arrow you are going to draw.
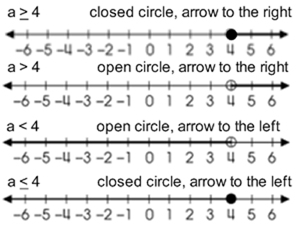
We know have everything we need to be able to graph inequalities. Below are four examples representing all four symbols.
Solving Inequalities
Take a look at the expression below:
6x + 4 > 40
If you imagine that the greater than or equal to sign were just an equal sign, you could solve for x using the rules for solving an equation. Well, guess what… solving an inequality works the exact same way. To solve for x in the previous inequality you would want to subtract the 4 and divide by 6.

This solution tells us we could pick any number greater than or equal to 6 and it would make our expression true. For example 10 > 6. If you put that into the original expression, 6(10) + 4 = 60 + 4 = 64 and 64 > 40 is a true statement, so our solution is correct. the final step would be to graph it. The > tells us that we will use a closed circle on the 6. It also tells us our arrow is going to point to the right, so our graph of that inequality is below.

There is one big difference when dealing with inequalities as compared to equations. This difference comes when dealing with negative numbers. You still perform the opposite operations the exact same way, and all of the rules for the operations still apply. The sign does switch directions when multiplying or dividing by a negative number. Here’s an example:

The reason for the switch has to do with the whole multiplying two negatives makes a positive. If you want to check the answer, pick a number less than -4, say -7. Put -7 into the original expression. -3(-7) + 6 = 21 + 6 = 27, and 27 > 18 is a true statement, therefore our solution is correct. The final thing we have left to do is to graph the inequality. We will use an open circle because it is only less than, not equal to, and the arrow will point to the left for less than.
