Assignment: 03-Graphing Inequalities
We have previously been made familiar with inequalities in such ways as:
7 < 12
or
1/2 > 1/4
There are two new symbols we need to become familiar with. We know the first two, pay careful attention to the next two:
- > Greater than
- < Less than
- > Greater than or equal to
- < Less than or equal to
These second two symbols are used more when we are working with a set of data, rather than a single number. It could look something like this.
{8, 9, 10, 11, 12} > 8
However, the set of data won’t commonly be represented as a set of data, but rather a varaible:
a > 8
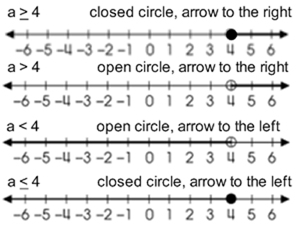
Having an inequality like that will commonly lead us to a line graph. You will have to mark the number to begin at, which in this case is the 8, and then draw an arrow to represent the variable, or set of data. There are two different marks used to mark the starting position. We call them an open circle or a closed circle. To know which circle to use, you simply have to look at the sign being used.

A little hint to remember it, when we plot a point on a number line we use a filled in dot. If our inequality can be equal to the value, the dot is filled in as well. the open circle represents the gap, meaning it cannot be equal to it.
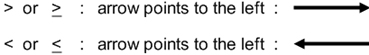
The other thing you need to know when graphing an inequality is which way to draw your arrow. This is fairly easy to remember because the direction of your inequality sign is the same as the direction of the arrow you are going to draw.
We know have everything we need to be able to graph inequalities. Below are four examples representing all four symbols.