Assignment - 12-Graphing Linear Equations
Assignment - 07-Functions and Graphs
This lesson combines the idea from the last lesson, that an equation can fill a t-chart, with graphing, from the previous week. Take a look at the example below:
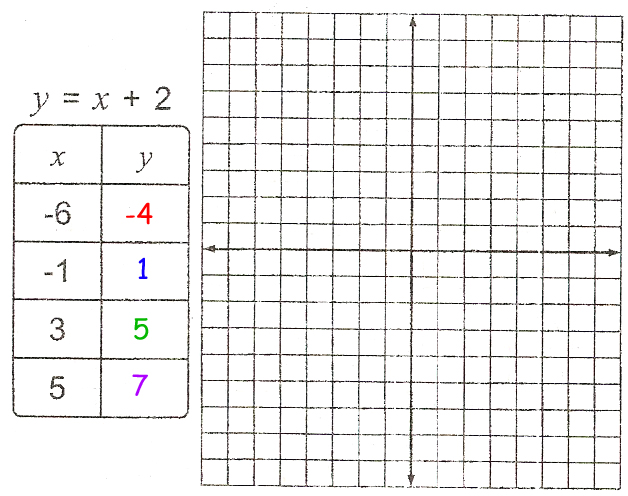
 The first step to solve these problems is going to be the exact same thing we did in the least lesson. You need to input the ‘x’ into the equation and figure out what the ‘y’ would be. If y=x+2, then our math would look like this: -6+2=-4, -1+2=1, 3+2=5, 5+2=7. The chart would then look like this:
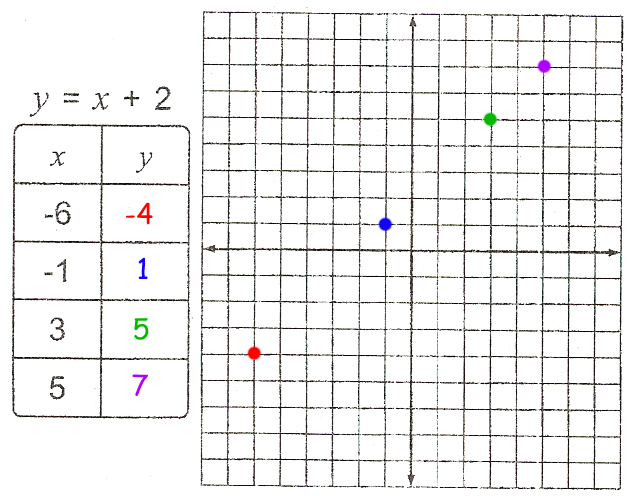
 The next step is to graph each of those points. Remember, you start at the origin for each point, and then move over to the x and up or down to the y. For the first point, we start at the origin, (0,0). you would move left to to -6, and down to -4. The second would move left to the -1 and up to 1. The third would move right to 3 and up to 5, and the final one would move right to 5 and up to 7. The points would then look as shown below.
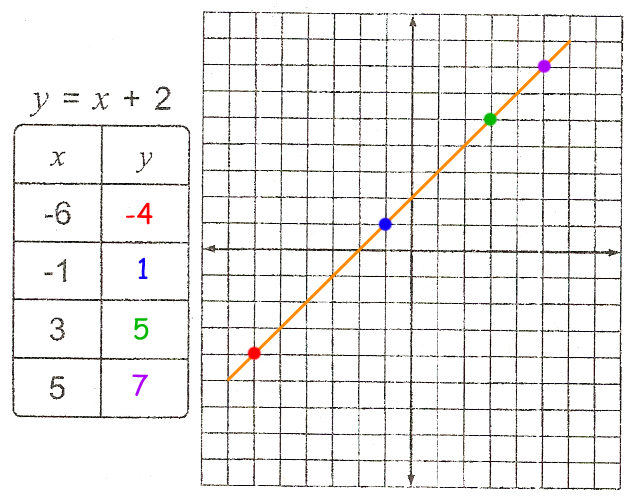
 All of the functions that the students will see in 6th grade will be what are known as linear equations. That means, if you have done your math correctly, and plotted the points in the right spot, they should line up in a straight line. This is the final step when graphing equations, to draw the line that connects the dots. Below is the finished product for what these problems will look like.