Assignment – Front: ratios in a table ; Back: ratios in a table2
At this point in time, we’ve dealt quite a bit with equivalent ratios in both making them larger, and simplifying them. Also remember, that proportions are simply a pair of equal ratios. We’ve also learned several different way to solve proportions which have an unknown variable in them.
This lesson simply takes everything we’ve known, and forces us to look at it in a new format. Below is a table filled with equivalent ratios. Notice, all I have done is multiplied the top and bottom by the same number to create the chart.
 We may also see this chart vertically. It means the exact same thing.
In this lesson we will be expected to fill in a chart with missing pieces.
 Now remember, a proportion is two equal ratios. To fill in this chart, we are basically solving a proportion.
 We could solve this using either method.
- Using a common multiplier. 5 x 4 = 20, so 1 x 4 =4; x=4
- Cross multiplying. 1×20÷5=4; x = 4
We would do this same thing for all three missing numbers.
1 x 6 = 6, so 5 x 6 = 30
1 x 10 = 10, so 5 x 10 = 50
Our finished chart would look as follows:
 This concept taken into a real world scenarios through the use of story problems.
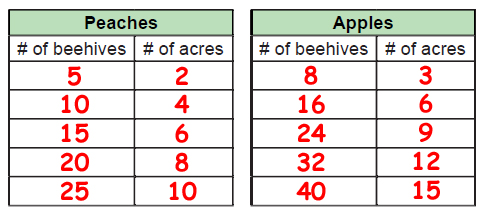
There is ax extra step in this problem where we have to come up with the starter ratio in the first row. Peaches would be 5:2 and apples would be 8:3. From there we would simply multiply them to create larger equal ratios.
To answer the question, which orchard has more beehives per acre, we would want to orchard when they’re on the same number of acres. Peaches are 15:6 and apples are 16:6, which means that apples have more beehives per acre.


