Topics
1. Patterns and Tables
2. Graphing Equations
3. Study Guide
4. Practice Questions
5. Unit 5 Test
Patterns and Table
We’ve had a bit of exposure to the idea of input output tables with rules. For example, if the rule is multiply by 2 and I input 3, then I do 3 x 2. The output would be 6. This takes is just a step further. In this lesson, the students are introduced to the vocabulary word function. A set of numbers are considered a function if every input, only has one output. Let’s take a look at the two charts below.
 If you look at Example A, you will notice that the numbers in the x column (input), are only listed once. From this chart we can determine that for each x there is only one y (output). If you look carefully at Example B, you will notice in the x column that -1 is listed twice, and each time it’s listed it has a different output. Because of this, this chat does not describe a function.
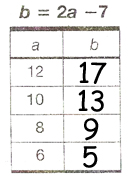
The next step would be to be able to fill in a t-chart based on the the input (the x) and the rule (an equation). Take the example below.
 It gives us an equations, (the rule), and it gives us to numbers to input into the equation. From there, we simply need to do the math. If a=12, then b=2(12) -7, or b=17. We could do this for any number really, but the other three in the chart would be b=2(10)-7=13, b=2(8)-7=9, and b=2(6)-7=5. The final chart would look like this.
 The final part to this lesson is to be able to look at a chart that represents a function, and figure out the rule. Let’s start with with Example A from the beginning. Remembering that we can use any of our four operations (+, -, x, ÷), we need to figure out what it is we are doing to the input, in that case, the x to get the y. In that instance, every output is four more than the input, so rule, or equation, would be y=x+4. Let’s take a look at another example:
 There is no one step that could describe this function. I mean, you could say multiply by 2.2, and that would work for the first one, but none of the others. That means, we are going to have a two step rule. We know that 11 is almost double 5, but 5*2=10, so we would have to add one to that. 5*2+1=11. You would then try that rule for the rest of them. 10*2+1=21, 15*2+1=31, 20*2+1=41. As you can see, our answers align to the chart, so the rule to this chart is ‘times 2 add 1′. To write this as an equations, we would say ‘y=2x+1′.
Graphing Equations
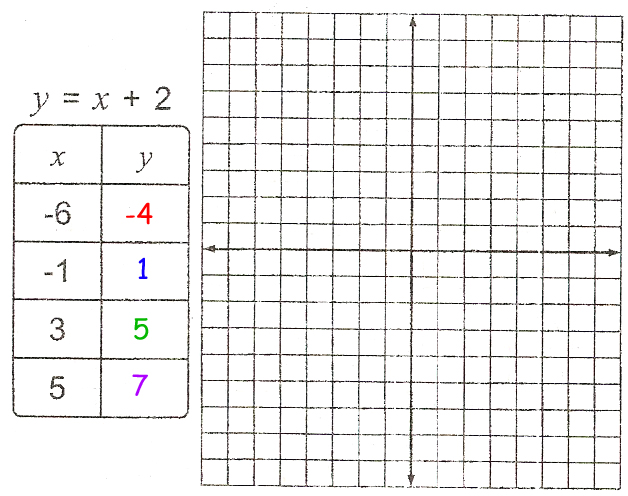
This lesson combines the idea from the last lesson, that an equation can fill a t-chart, with graphing, from the previous week. Take a look at the example below:
 The first step to solve these problems is going to be the exact same thing we did in the least lesson. You need to input the ‘x’ into the equation and figure out what the ‘y’ would be. If y=x+2, then our math would look like this: -6+2=-4, -1+2=1, 3+2=5, 5+2=7. The chart would then look like this:
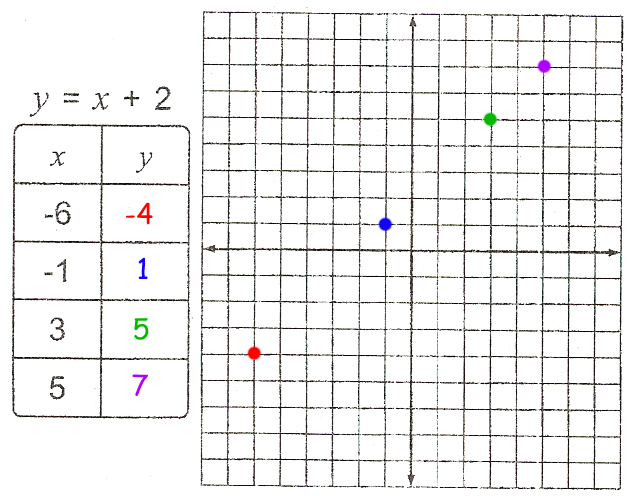
 The next step is to graph each of those points. Remember, you start at the origin for each point, and then move over to the x and up or down to the y. For the first point, we start at the origin, (0,0). you would move left to to -6, and down to -4. The second would move left to the -1 and up to 1. The third would move right to 3 and up to 5, and the final one would move right to 5 and up to 7. The points would then look as shown below.
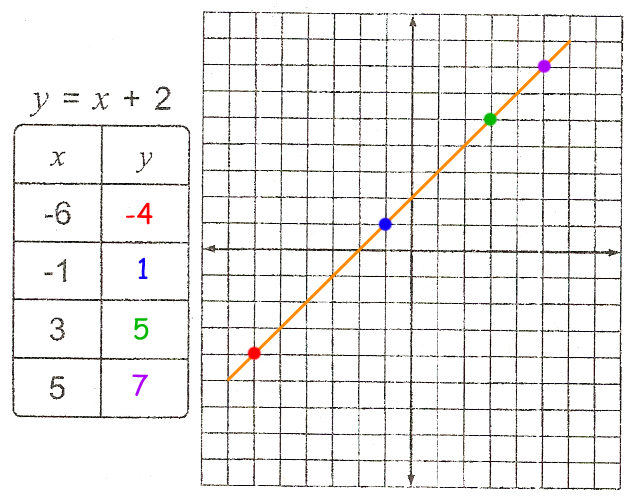
 All of the functions that the students will see in 6th grade will be what are known as linear equations. That means, if you have done your math correctly, and plotted the points in the right spot, they should line up in a straight line. This is the final step when graphing equations, to draw the line that connects the dots. Below is the finished product for what these problems will look like.
Testing
Unit 5 Study Guide – Filled In
I will post the practice questions here, as soon as I have them created….

